How to use SEI’s GIS Web Map
Take a tour of the SEI GIS Web Map workspace
The GIS Web map workspace is broken down into 4 areas on the screen: the Map, the Selected Data Grid, the Maps Settings Toolbar and the Navigation Toolbar.
Set up your custom basemap background
Set the background style of your map from 10 different basemap options, ranging from satellite imagery to road maps.
Learn about Web Map data layers and control what layers you see
SEI’s seismic library is comprised of over 1,650,000 miles of 2D data and 55,000 square miles of 3D seismic data. For easier viewing, the library has been broken down into “layers”.
· 2D Seismic – SEI’s entire 2D seismic library
· 2D Reprocessed – just the 2D seismic data that has been processed since 2008
· 3D Seismic – SEI’s entire 3D seismic library
· 3D Reprocessed – just the 3D seismic data that has been processed since 2008
You can control which layers are displayed and available for searching, filtering and selecting on the Web Map.
Although you can display multiple seismic layers on your map, only data in the Active Layer can be selected or identified using the GIS Web Map tools. Use the Selected Data Grid to monitor which layer is the Active Layer and to change the Active Layer with a click.
Easily zoom in to your area of interest, zoom out to get the big picture, move or pan the map to the side or up and down to see nearby areas, calculate linear or area measurements and request digital maps of seismic data within a specified range of selected lat/long coordinates with the GIS Map tools.
Search for and select seismic data
Select seismic data in your area of interest using an array of Web Map selection tools including a line name/survey name search or a map search using a rectangle or polygon selection tools.
Data selected on the map is displayed in the Selected Data Grid and available for further refining, reporting and queuing for a QC request.
Submit a data QC request to SEI
Add selected data from any layer to a QC request queue and then submit the request to SEI. You will be contacted by your marketing representative to QC the seismic data you have selected.
View the GIS Web Map Tools Dictionary
Take a tour of the SEI GIS Web Map workspace

The Map
The Map displays SEI’s 2D and 3D seismic library and covers nearly the entire screen, but will be partially hidden along the bottom of the screen when the Selected Data Grid is displayed.
The Selected Data Grid
The Selected Data Grid serves as the command center for all of your GIS Web Map activities and has three important functions:
1. Layer Control. There is a tabbed grid for each layer displayed on the map, with an indicator for the Active Layer. You can change which layer is the Active Layer by simply clicking on a non-active tab.
2. Working with Selected Data. As you select data on the map, key attributes of the data are listed in the Selected Data Tab. You can further refine your data selection with advanced search tools or you can report on the selected data by exporting key attribute information and/or shape files.
3. Submitting a QC. You can queue some or all of the selected data for addition to a QC request and then submit the QC request to SEI.
The Map Settings Toolbar
The Map Settings Toolbar, located on the top right of the screen, allows you to customize the way your map looks by selecting the style of the basemap background and what seismic data layers will be displayed. If you know all or part of the line name/survey name that you are looking for the Query Tool on the Map Settings Toolbar allows you to go directly to the data instantly, without having to navigate the map.
The Navigation Toolbar
The Navigation Toolbar, located on the top left of the screens provides you with the tools to zoom in and out, pan the map in any direction, identify and select data in the Active Layer and undo/redo your recent actions.
Set up your custom basemap background
What choices do I have for my basemap background?
The GIS Web Map provides 10 different options for a basemap background.
s Imagery
s Imagery with Labels
s National Geographic
s Oceans
s Open Street Map
s Streets
s Terrain with Labels
s Topographic
s Blank Background
Try each of the basemap backgrounds out to see which one is the most helpful for your data search objectives.
How do I set my basemap background?
1. Click the Basemap Gallery Tool on Map Settings Toolbar
![]()
2. Click to select your desired basemap background

3. Apply your selection and close the Basemap Gallery Tool by clicking the x in the upper right corner.
Learn about the Web Map data layers and control what layers you see.
What are GIS Web Map layers?
The GIS Web Map works by displaying or not displaying “layers” as instructed by you, the user. SEI’s proprietary seismic library is comprised of over 1,650,000 miles of 2D data ad 55,000 square miles of 3D seismic data. For easier viewing, the library has been broken down into layers.
s 2D Reprocessed – SEI’s proprietary 2D seismic data that has been processed since 2008
s 3D Reprocessed – SEI’s proprietary 3D seismic data that has been processed since 2008
s 2D Seismic – SEI’s entire proprietary 2D seismic library
s 3D Seismic – SEI’s entire proprietary 3D seismic library
The GIS Web Map has additional layers that may be helpful in your web map searching; State, Province, County and Offshore area boundaries (Culture). It should be noted that some of the basemap backgrounds may display information included in these layers, so you may turn these layers on or off depending upon your basemap selection.
s States – State boundaries in the United States as well as Province boundaries in Canada
s Counties – County line boundaries in the United States
s Culture – Gulf of Mexico offshore area boundaries
SEI serves as the Prime Broker for a number of companies, marketing their proprietary data to the industry. When you select these layers for viewing, the prime broker data can be viewed, identified and selected for QC using the GIS Web Map tools.
s 2D Prime – third party 2D seismic data brokered by SEI
s 3D Prime – third party 3D seismic data brokered by SEI
How can I display or hide these layers?
1. Click the Layer List Tool on Map Settings Toolbar
![]()
2. Check the layers you would like to display and uncheck the layers you would like to hide
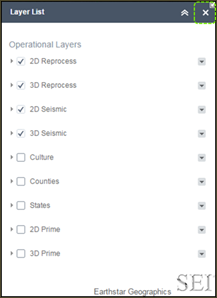
3. Apply your selection and close the Layer List Tool by clicking the x in the upper right corner.
How do I identify what layers are displayed on the Web Map?
The data in each layer is identified by color code which can be viewed by opening the map legend using the Legend Tool on the Map Settings Toolbar.
1. Click the Legend Tool on Map Settings Toolbar
![]()
2. A color coded legend will be displayed for each layer you have currently selected for your GIS Web Map.
¢ 2D Reprocessed
¢ 3D Reprocessed
¢ 2D Seismic
¢ 3D Seismic
¢ 2D Prime
¢ 3D Prime
3. Close the Legend Tool by clicking the x in the upper right corner.
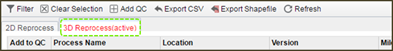
Understand the Active Layer
Although you can display multiple data layers on the GIS Web Map, you can only work with one data layer at a time. That layer is referred to as the Active Layer.
The Selected Data Grid will display a tabbed grid for each data layer you have selected to display on your GIS Web Map. The tab name for the Active Layer will always appear in red font followed by the “(active)” identifier. The Selected Data Grid will automatically pop up any time you start to use any Web Map tool that involves identifying, selecting or querying data, so that you will be able to monitor the Active Layer that you are working in. If you find that you can see seismic data on the Web Map, but cannot select it, check the Selected Data Grid to see if you have the proper layer selected as the Active Layer.

To work with data in a different layer, simply click that tab on the Selected Data Grid and that layer will become the Active Layer. The tabbed grid for that layer will be displayed on top of all the other grids and the tab name will appear in red font followed by the “(active)”.
Navigate around on the map
The GIS Web Map allows you to interactively move around the map, zoom in to get a close up view and zoom out to get the big picture. You conduct this activity using the tools located on the Navigation Toolbar.
How do I zoom in to get a close look at a particular location?
1. Click the Zoom In Tool on the Navigation Toolbar.
![]()
2. The first time you click the tool, there will be pause waiting for you to draw a rectangle around the area you would like to zoom to. Use your mouse to draw a rectangle and, the Web Map will zoom in to display your area close up.

3. If you do not draw a rectangle, clicking the tool again will initiate a small zoom in to the center of the displayed map area. Each consecutive click of the tool without drawing a rectangle will iteratively zoom in to the center of the displayed map area.

4. At any time, you can zoom back out to the original map size by clicking the Home icon on the upper left side of the map.
![]()
How do I zoom out to get the big picture?
1. Click the Zoom Out Tool on the Navigation Toolbar.
![]()
2. The first time you click the tool, there will be pause waiting for you to draw a rectangle indicating how far out you would like to zoom. Use your mouse to draw a rectangle and, the larger the rectangle is, Web Map will zoom out less.
3. The smaller your rectangle is, the Web Map will zoom out more.

4. If you do not draw a rectangle, clicking the tool again after the pause will initiate a small zoom out from the center of the displayed map area. Each consecutive click of the tool without drawing a rectangle will iteratively zoom out from the center of the displayed map area.
5. At any time, you can zoom back out to the original map size by clicking the Home icon on the upper left side of the map.
![]()
How do I look at an area just to the east, west, north or south of the current displayed area?
1. Click the Pan Tool on the Navigation Toolbar.
![]()
2. Click somewhere in the middle of the map and hold your mouse button down. The cursor arrow will change into an arrow pointing in 4 directions. While continuing to hold your mouse button down, drag the map so that the area you would like to see falls within the map window. Release your mouse when you get the map focused on your area. As long as you stay selected on the Pan Tool, you can continue with successive moves of the map.
3. At any time, you can return to the original map location and size by clicking the Home icon on the upper left side of the map.
![]()
How can I undo a navigation move I just made?
1. Click the Back Tool on the Navigation Toolbar to undo recent navigation functions. The Back Tool will not undo map selections made with the Rectangle/Polygon Map Selection Tools
![]()
2. Click the Forward Tool on the Navigation Toolbar to redo any navigation functions you recently undid. The Forward Tool will not redo and map selections made with Rectangle/Polygon Map Selection Tools.
![]()
Search for and select seismic data
The GIS Web Map has puts a number of tools at your fingertips to find the seismic data you’re looking for. It is important to monitor and control which data layer is the Active Layer while you are working with the Web Map search tools, by checking for the active identifier on the Selected Data Grid. You can only search for and select data that resides in the Active Layer.
How do I view basic information about a 2D line or a 3D survey before I select it?
1. Click the Identify on the Navigation Toolbar.
![]()
2. Check the Selected Data Grid to make sure the Active Layer is set properly.
2D Example: 3D Example:

3. 2D Example: Click on the 2D line you are interested in. It will be changed to a light blue color and a pop up window will appear with key information about your line of interest.
3D Example: Click on the 3D survey you are interested in. It will become outlined in a light blue color and a pop up window will appear with key information about your survey of interest along with a link to open a 3D Survey Info Sheet.


4. To close the pop up window, simply click the x in the upper right corner or click on your next 2D line or 3D survey of interest.
How can I select data that I’m interested in?
The SEI GIS Web Map offers four powerful tools that you can use to select data that you are interested in.
1. Rectangle Selection Tool
2. Polygon Selection Tool
3. 2D Seismic Query Tool
4. 3D Seismic Query Tool
Once you select data with any of these tools, you can work your data in the Selected Data Grid to further refine your search, export key information about the data, export a Shapefile with mapping information and submit a QC request.
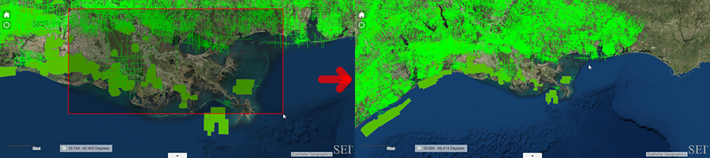
How can I select data from the Web Map using the Rectangle Selection Tool?
1. Click the Rectangle Selection Tool on the Navigation Toolbar.
![]()
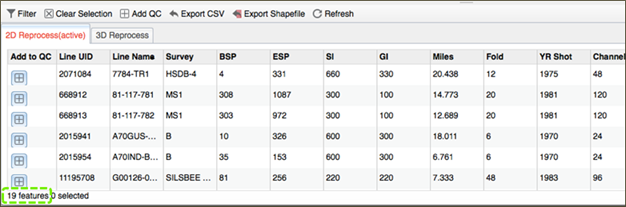
2. As soon as you click on the Rectangle Selection Tool, the Selected Data Grid will automatically be displayed. Check the setting for the Active Layer and reset if necessary by clicking on the desired tab. The default setting for data displayed in the grid is to initially display all data that resides in the layer
2D Example: Selected Data Grid before making a selection with the Rectangle Selection Tool

3D Example: Selected Data Grid before making a selection with the Rectangle Selection Tool

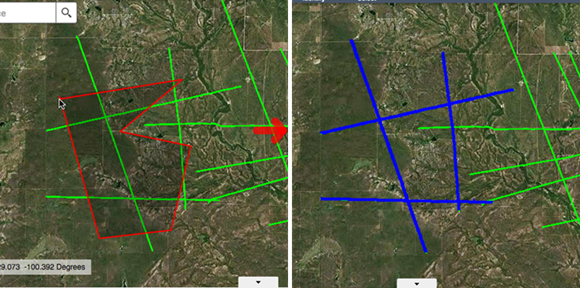
3. Draw a rectangle around your areas of interest. Any data in the Active Layer that passes through your rectangle will be selected and displayed in blue. The Web Map will zoom in to provide the closest possible view of all selected data.
2D Example: Two 2D lines pass through the rectangle and are subsequently displayed in blue

3D Example: Two 3D surveys pass through the rectangle and are subsequently displayed in blue.

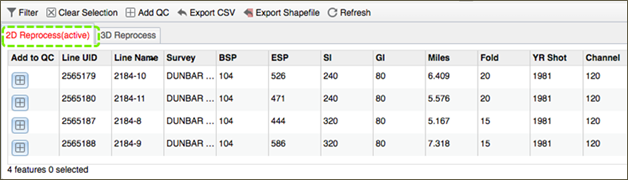
4. The data listed in the Selected Data Grid for the Active Layer will be replaced with only the data you selected using the Rectangle Selection Tool. The data selected from the Web Map is now ready for further refinement in the Selected Data Grid.
2D Example: Selected Data Grid after making a selection with the Rectangle Selection Tool

3D Example: Selected Data Grid after making a selection with the Rectangle Selection Tool

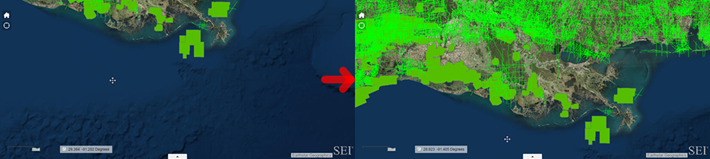
How can I select data from the Web Map using the Polygon Selection Tool?
1. Click the Polygon Selection Tool on the Navigation Toolbar.
![]()
2. As soon as you click on the Polygon Selection Tool, the Selected Data Grid will automatically be displayed. Check the setting for the Active Layer and reset if necessary by clicking on the desired tab. The default setting for data displayed in the grid is to initially display all data that resides in the layer
2D Example: Selected Data Grid before making a selection with the Polygon Selection Tool
3D Example: Selected Data Grid before making a selection with the Polygon Selection Tool
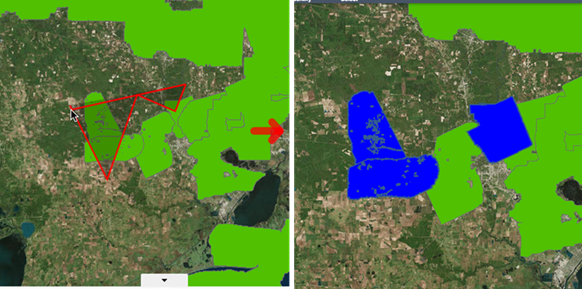
3. Draw a multi-sided polygon by clicking and releasing the mouse for each corner of the polygon. Any data in the Active Layer that passes through your polygon will be selected and displayed in blue. The Web Map will zoom in to provide the closest possible view of all selected data.
2D Example: Two 2D lines pass through the polygon and are subsequently displayed in blue
3D Example: Two 3D surveys pass through the polygon and are subsequently displayed in blue.
4. The data listed in the Selected Data Grid for the Active Layer will be replaced with only the data you selected using the Polygon Selection Tool. The data selected from the Web Map is now ready for further refinement in the Selected Data Grid.
2D Example: Selected Data Grid after making a selection with the Polygon Selection Tool
3D Example: Selected Data Grid after making a selection with the Polygon Selection Tool

Can I go directly to the data if I know all or part of the line name or survey name?
Yes.The Query Tool located on the Map Settings Toolbar provides a quick way to select data without having to navigate around the map.
How do I get started with the Query Tool?
1. The first step in using the Query Tool is to make sure the data layer you are interested in searching is currently set as the Active Layer. Display the Selected Data Grid to see which layer is the Active Layer. You can change the Active Layer simply by clicking on the desired data layer tab in the Selected Data Grid.

In the Selected Data Grid, each 2D line you selected is referred to as a Feature. Initially, all 2D lines or 2D surveys in the data layer will be displayed on the Selected Data Grid, which will be reflected in the total number of Features displayed in the Grid Status Bar at the lower left corner of the grid.
2. Click the Query Tool on the Navigation Toolbar.
![]()
3. The Query Tool main screen will be displayed. Select they layer you are interested in searching, which should also be the Active Layer and the Query Tool detail screen will be displayed. Now you are ready to start building your query.

How do I enter the line name or survey name that I want to search for?
1. Enter all or part of the line name or survey name into the line name box. The Query Tool automatically places a wildcard at the beginning and end of what you have entered. You can enter a “%” wildcard character to represent one or more characters in the middle of the name.
2D Examples:

3D Examples:

2. You can search for multiple 2D lines or 3D surveys in a single query, just enter each line name or survey name with a comma in between (no spaces). This feature is particularly helpful if you have a comma separated list of lines that you can copy and paste into the line name box. The wildcard character will work not for multiple line/survey queries.
How do I limit the search area to a specific area on the GIS Web Map?
1. By default, the Query Tool will search through all data in the Active Layer, regardless of its location on the map. You can control this default setting via a checkbox in the middle of the Query Tool screen. If you want to search the entire map, make sure the checkbox is unchecked.
![]()
2. If you want to focus your query on a specific area of the map, check this checkbox. You will be offered two options for refining your search area.

s Visible Map
The first option assumes that you have already used the Zoom In Tool on the Navigation Toolbar to zoom to your area of interest. If you select this option, your query will be limited to data that is in the portion of the map visible on your screen.
s Inside a Shape
The first allows you to draw a shape to define the area your area of interest. If you select this, your query will be limited to the data that passes through the shape you draw. You can chose from a number of different shape tools to draw your shape. Click the “Clear” link to redraw the shape.
Can I compile the results from consecutive queries?
1. Once you have defined your query with the Query Tool, click the “SEARCH” link in the upper right corner of the Query Tool screen. The results will be displayed in the Selected Data Grid and the will be displayed in blue on the GIS Web Map.

2. By default, the Query Tool will clear the results from your previous query each time you run a new query. You can control this default setting via a checkbox at the bottom of the Query Tool screen. If you want to clear your results each time you run a new query, make sure this checkbox is unchecked.
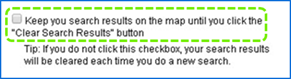
3. If you want to compile consecutive query results check this checkbox. The results from each new query will be added to previous results in the Selected Data Grid and all query results will be displayed in blue on the GIS Web Map. This is particularly useful if you want to build a data list to submit as a QC request. The Query Tool will continue to keep your query results until you click the “Clear Results” button at the bottom of the Query Tool screen.

4. To navigate back to the main Query Tool screen, click the “QUERIES” link at the top of the Query Tool screen.

Work with the data you select on the GIS Web Map
Further refine the data you selected from the GIS Web Map Using the Selected Data Grid Tools.
¨ Use the Filter Tool to create quick and easy filters to narrow your list of selected data
¨ Use the Export CSV Tool to export key information about your data to an Excel compatible file
¨ Use the Export to Shapefile Tool to export the mapping coordinates of your data to a file compatible with most mapping applications
¨ Use the QC Tool to create and submit an e-request directly to SEI to quality check your selected data
How do I narrow my selected data list to just the data I’m interested in?
After selecting data from the GIS Web Map, you may want to further narrow this list of data, for example, you may only be interested in data with a fold greater than 50. The Filter Tool allows you to quickly and easily establish criteria to exclude data that does not meet your criteria.
1. Begin by working in the Active Layer that best suits your needs. Data you select with the Rectangle Selection Tool, Polygon Selection Tool or Query Tool will be displayed in blue on the Web Map.

2. In the Selected Data Grid, each 2D line or 3D survey you selected is referred to as a Feature. The total number of Features that have been selected from the map are displayed in the Grid Status Bar at the lower left corner of the grid. Click the Filter Tool to narrow the list of Features to meet your criteria.

3. A wide range of filtering capabilities is at your fingertips with the Filter Tool. You can create a quick single criteria filter expression or you can build a targeted, complex filter expression comprised multiple independent criteria or sets of criteria that are interrelated. The Filter Tool uses the same simple approach for creating single criteria, multiple criteria and criteria set filter expressions. You control the complexity by the number of filter expressions you add to the Filter Tool.

4. In the Filter Tool screen, click the link for single criteria filter expression. Let’s assume you want to only see data with a fold greater than 50. Enter the following information into the Filter Tool expression builder.

To run the filter, click the OK button. The data listed in the Selected Data Grid will be limited to only data where the fold is greater than 50 and the count of Features in the Grid Status Bar will be updated accordingly.
5. The expression builder in the Filter Tool offers three options for setting up your filter criteria:
s Value – enter a discrete value that you want to use as a comparison or cutoff. Going back to the earlier fold example, the discrete value would be 50.

s Field – select another field that the key information will be compared to. For example, you want to identify all 2D lines in your selected data where the Group Interval is greater than Shot Interval.

s Unique – select a specific value from the third dropdown, listing all the unique values for that field in your selected data. For example, you may have 100 2D lines in your selected data, but they are associated with only 10 surveys. The unique list would only display the 10 surveys, each only once. After running this filter, only data in the “A Little Luck” survey would be listed in the Selected Data Grid.
![]()
6. To create a filter expression with a set of related criteria, click the criteria set link in the Filter Tool. Build each filter expression in the set using the same guidelines for a single criteria filter expression. However, you will need to specify whether the filtered data must meet all of the filter expressions in the set (“All”) or may only meet one of the filter expressions in the set (“Any”).

How do I undo a filter and go back to the data I originally selected from the GIS Web Map?
Click the “X” directly to the right of each filter expression or set of expressions to delete it. Click OK to accept the deletion. If you delete all filter expressions from the Filter Tool, you will return to the original list of data you selected from the GIS Web Map.

Can I export key information about my selected data to Excel?
Key information displayed in the Selected Data Grid can be exported to a CSV file which can be opened by and is compatible with Excel. If you have narrowed your selected data using the Filter Tool, only the data that meets your filter criteria will be exported to the CSV file. If you are interested in exporting key information about data residing in different layers, for example 2D Reprocessed data and 3D Reprocessed data, simply repeat this process for each layer.
1. Begin by working in the Active Layer that best suits your needs. Data you select with the Rectangle Selection Tool, Polygon Selection Tool or Query Tool will be displayed in blue on the Web Map.

2. In the Selected Data Grid, each 2D line or 3D survey you selected in the GIS Web Map is referred to as a Feature. Use the Filter Tool to further refine the list of Features, as needed. The Features that meet your filter criteria will be displayed in the Selected Data Grid and the total count of those Features will be displayed in the Grid Status Bar in the lower left corner.

3. Click the Export CSV Tool to export the information displayed in the Selected Data Grid to a CSV file. You will be prompted with a screen to confirm your export. Click OK and the exported file will appear as a download to your local computer.

4. When you open the downloaded CSV file, it should automatically open with Excel and look just like an Excel file. To save the file as an Excel file, choose “Save As” from the Excel file menu and change the File Type to Excel Workbook.

Can I export mapping information about my selected data to a Shapefile?
Mapping coordinate information for the data displayed in the Selected Data Grid can be exported to a Shapefile which is a standard format that can be read by most mapping systems. If you have narrowed your selected data using the Filter Tool, only the data that meets your filter criteria will be exported to the Shapefile. If you are interested in exporting mapping information for data residing in different layers, for example 2D Reprocessed data and 3D Reprocessed data, simply repeat this process for each layer
1. Begin by working in the Active Layer that best suits your needs. Data you select with the Rectangle Selection Tool, Polygon Selection Tool or Query Tool will be displayed in blue on the Web Map.

2. In the Selected Data Grid, each 2D line or 3D survey you selected in the GIS Web Map is referred to as a Feature. Use the Filter Tool to further refine the list of Features, as needed. The Features that meet your filter criteria will be displayed in the Selected Data Grid and the total count of those Features will be displayed in the Grid Status Bar in the lower left corner.

3. Click the Export Shapefile Tool to export the information displayed in the Selected Data Grid to a compressed Shapefile. You will be prompted with a screen to confirm your export. Click OK and the exported file will appear as a download to your local computer.
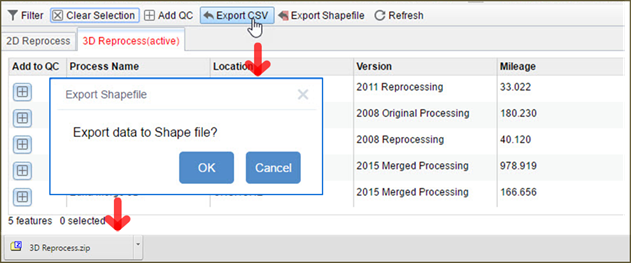
4. Once the downloaded file has been uncompressed, it can be input into your mapping software and the selected data can be mapped alongside other information in your mapping system.
Submit a data QC request to SEI
Submitting a QC request to SEI for data is fast and easy with the GIS Web MAP using the tools in the Selected Data Grid.
s Working in the Active Layer, select data from the GIS Web Map in your area of interest using the Rectangle Selection Tool or the Polygon Selection Tool, or if you know all or part of the line name or survey name select data using the Query Tool. The data you select will be listed in the Selected Data Grid at the bottom of the screen.
s Further refine your data in the Selected Data Grid with the Filter Tool, which allows you to establish additional criteria, such as a date range for most recent processing, or a desired fold range.
s Add to the data QC request and submit.
Can I submit a QC request that contains both 2D data and 3D data?
Currently, you must submit separate QC requests for 2D data and 3D data, however the steps are nearly identical for both types of data.
How do I create a QC request for 2D data?
1. Begin by working in the Active Layer that best suits your needs. If you are interested in choosing data in your area of interest regardless of the latest process date, work in the 2D Seismic layer. If you are only interested in data that has been processed since 2008, work in the 2D Reprocess layer. Data you select with the Rectangle Selection Tool, Polygon Selection Tool or Query Tool will be displayed in blue on the Web Map.

2. In the Selected Data Grid, each 2D line you selected is referred to as a Feature. The total number of Features that have been selected from the map are displayed in the Grid Status Bar at the lower left corner of the grid.
3. Select a single Feature from the grid by clicking on it. The Feature row will be highlighted and Grid Status Bar will reflect that one Feature has been selected.

4. The Feature you have selected will be displayed in a lighter shade of blue on the map.

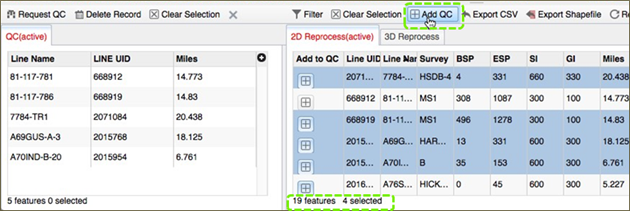
5. To add the data Feature you selected to a QC request, click on the Add to QC button in the furthest left column of the grid. A new QC Request Grid will appear directly to the left of the Selected Data Grid displaying with the Feature you just added to the QC.

6. To select multiple contiguous Features in the grid, click on the first Feature, hold the shift key down and then click on the last desired contiguous Feature. To select multiple non-contiguous Features from the grid, click on the first Feature and while continuously holding the control key down, click on the additional desired Features in the grid. The Feature rows will be highlighted and Grid Status Bar will reflect that number of Feature you have selected.

7. To add multiple selected data Features to a QC request at the same time, simply click on the Add QC button located at the top of the Selected Data Grid and the selected Features will be displayed in the QC Request Grid.
8. If you wish to add data from other areas of interest to your QC request, simply return to the Web Map in the same Active Layer, use the Rectangle Selection Tool, Polygon Selection Tool or Query Tool to select additional data and repeat the process.
How do I create a QC request for 3D data?
1. Begin by working in the Active Layer that best suits your needs. If you are interested in choosing data in your area of interest regardless of the latest process date, work in the 3D Seismic layer. If you are only interested in data that has been processed since 2008, work in the 3D Reprocess layer. Data you select with the Rectangle Selection Tool, Polygon Selection Tool or Query Tool will be displayed in blue on the GIS Web Map.

2. In the Selected Data Grid, each 3D survey is referred to as a Feature. The total number of Features that have been selected from the map are displayed in the Grid Status Bar at the lower left corner of the grid.

3. Select a single Feature from the grid by clicking on it. The Feature row will be highlighted and Grid Status Bar will reflect that one Feature has been selected.

4. The Feature you have selected will be outlined in a lighter shade of blue on the map.

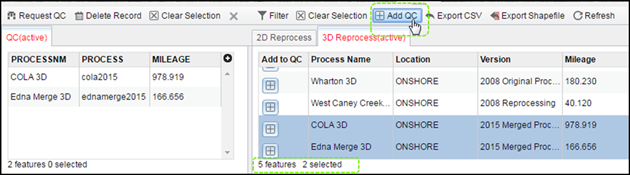
5. To add the data Feature you selected to a QC request, click on the Add to QC button in the furthest left column of the grid. A new QC Request Grid will appear directly to the left of the Selected Data Grid displaying with the Feature you just added to the QC.

6. To select multiple contiguous Features in the grid, click on it the first Feature, hold the shift key down and then click on the last desired contiguous Feature. To select multiple non-contiguous Features from the grid, click on the first Feature and while continuously holding the control key down, click on the additional desired Features in the grid. The Feature rows will be highlighted and Grid Status Bar will reflect that number of Feature you have selected.

7. The Features you have selected will be outlined in a lighter shade of blue on the map.

8. To add multiple selected data Features to a QC request at the same time, simply click on the Add QC button located at the top of the Selected Data Grid and the Features will be displayed in the QC Request Grid.
9. If you wish to add data from other areas of interest to your QC request, simply return to the GIS Web Map in the same Active Layer, use the Rectangle Selection Tool, Polygon Selection Tool or Query Tool to select additional data and repeat the process.
How do I delete a 2D line or 3D survey from my QC request?
1. Click on the data Feature in the QC Request Grid that you wish to delete. The QC Status Bar in the lower left corner will reflect the total number of Features in the QC and the number of Features you have selected.

2. Click the Delete Record button and the selected data Feature(s) will be deleted from the QC Request Grid. This procedure is identical for both 2D QC requests and 3D QC requests.

How do I submit a QC request?
1. Once you have finished adding data Features to the QC Request Grid, simply click the Request QC button.

2. You will be prompted with a screen to enter your contact information and to select the SEI marketer that you have worked with in the past. If you do not currently work with an SEI marketer, select “Assign A Marketer”. Click the Submit button and you will receive an email confirmation of your QC request, along with a report listing all the data requested for QC.

What if I decide I’m not ready to submit a QC request that I started?
1. Multi-select all of the Features in the QC Request Grid. The QC Status Bar in the lower left corner will reflect that all Features in the QC Request Grid are selected. Click the Delete Record Tool to delete all of the selected Features. Then click the “X” button to hide the empty QC Request Grid.

Map Settings Toolbar
![]()
Build queries with line name or survey name information to quickly find data. Learn More
![]()
Draw a line or shape to estimate the linear or square mileage of an area on the map.
![]()
Select the data layers you want to be displayed on the map. Learn More
![]()
Open the legend to check which layers are currently displayed on the map.
![]()
Select the map background from a gallery of 10 different options. Learn More
![]()
Check the latest version of the GIS Web Map application and submit help requests.
Navigation Toolbar
![]()
Zoom in to get a close up of your area of interest. Learn More
![]()
Zoom out to get the big picture. Learn More
![]()
Undo your last navigation move. Learn More
![]()
Redo a navigation move. Learn More
![]()
Request a pdf version of your map.
![]()
Move around to see other areas on the map. Learn More
![]()
Display key information about a 2D line or 3D survey. Learn More
![]()
Display the Help file
![]()
Select data that passes through a rectangle you draw. Learn More
![]()
Select data that passes through a polygon you draw. Learn More
![]()
Clear selections you made with the Rectangle or Polygon Selection Tools. Learn More
Selected Data Grid Toolbar
![]()
Establish criteria to refine the data you selected from the map. Learn More
![]()
Deselect data you have selected within the grid. Learn More
![]()
Add data to a QC. Learn More
![]()
Export key information about your selected data to an Excel compatible file. Learn More
![]()
Export mapping coordinate information about your selected data. Learn More
![]()
Refresh the grid to display all data in the selected layer.
QC Toolbar
![]()
Submit a QC request to SEI for all data you’ve added to the QC grid. Learn More
![]()
Delete data from the QC grid. Learn More
![]()
Deselect data you have selected within the QC grid. Learn More
![]()
Close or hide the QC grid. Learn More